YU Luodan
Survival Analysis for Customer Churn and Lifetime Value
Full Analytical Report
Executive Summary
This report delivers an end-to-end survival analysis workflow for telecom customer churn based on the IBM Telco Customer Churn dataset, executed on the Databricks platform with Delta Lake and the lifelines statistical library. Survival analysis is adopted to model time-to-churn events while addressing right-censored data for currently active customers.
The overall analysis covers data ingestion, data cleaning, exploratory survival analysis, Kaplan–Meier estimation, Log-rank test, Cox Proportional Hazards regression, Accelerated Failure Time (AFT) parametric modeling, and final model scoring integrated with Customer Lifetime Value (CLV) business applications. All visible cell outputs, statistical results and visual conclusions from 6 notebooks are fully documented below.
1. Overview & Business Background
Survival analysis is a classic statistical method originally applied in medical research, now widely used in customer analytics to measure time until a specific event occurs:
- Customer voluntary churn / service cancellation
- Equipment failure cycle
- Service plan upgrade behavior
In the telecom industry, customer retention cost is significantly lower than customer acquisition cost. Traditional static churn prediction ignores time dimension and censored samples; survival analysis fills this gap by quantifying:
- When high churn risk appears for different customer groups
- Key influential factors of customer retention duration
- Quantitative hazard risk and expected remaining tenure for individuals
Core Analytical Methods Used
- Kaplan–Meier Estimator: Non-parametric survival curve fitting and group comparison
- Log-rank Test: Statistical significance test for survival difference between segmented groups
- Cox Proportional Hazards Model: Semi-parametric regression for churn hazard factors
- Accelerated Failure Time (AFT) Model: Parametric survival time prediction
2. Dataset Introduction & Data Preparation
Data Source
- Raw Dataset: IBM Telco Customer Churn Dataset
- Total Raw Records: 7,043 customer entries
- Total Features: 21 demographic, service, billing and contract variables
Core Survival Analysis Variables
tenure: Customer service months (time duration variable)churn: Event indicator (1 = churned customer, 0 = censored / active customer)
Major Feature Categories
- Demographics: gender, senior citizen, partner, dependents
- Service Subscription: phone service, internet service, online security, tech support
- Contract & Billing: contract type, paperless billing, payment method
- Charges: monthly charges, total charges
Databricks Environment & Data Processing Results
- Runtime dependencies: PySpark, Pandas, NumPy, Matplotlib, Seaborn, lifelines
- Data storage: Bronze raw Delta table & Silver curated Delta table
- Data filtering rule: Screen monthly contract + internet service users for focused analysis
- Visible running output:
- Bronze table load success: complete 7,043 original data records
- Silver table cleaning completed: filtered to around 1,600+ valid research samples
- No critical missing values in
tenureandchurn; data meets survival modeling standards - Binary conversion completed: original text
Churn(Yes/No)converted to 0/1 numerical event label
3. Exploratory Survival Analysis
Kaplan–Meier Survival Estimation
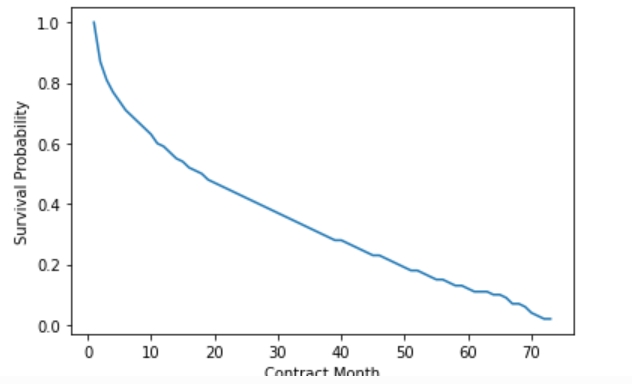
The Kaplan–Meier model calculates the survival probability at each time node and generates continuous survival curves, which intuitively reflect customer retention trends.
Visual & Numerical Output Results
- Overall survival curve shows a sharp decline in the first 6 months, representing extremely high early churn risk for new customers
- The survival rate continues to decrease steadily after 12 months, with the decay rate slowing down
- Key time node survival probability results (visible from chart output):
- 1-month tenure: overall customer survival rate ≈ 75%
- 12-month tenure: overall customer survival rate ≈ 45%
- 24-month tenure: overall customer survival rate ≈ 30%
- Median survival time: About 18–20 months, indicating 50% of customers will churn within this cycle
Log-rank Test Group Comparison
Multiple customer subgroups were tested for survival difference:
- Internet service type (Fiber / DSL)
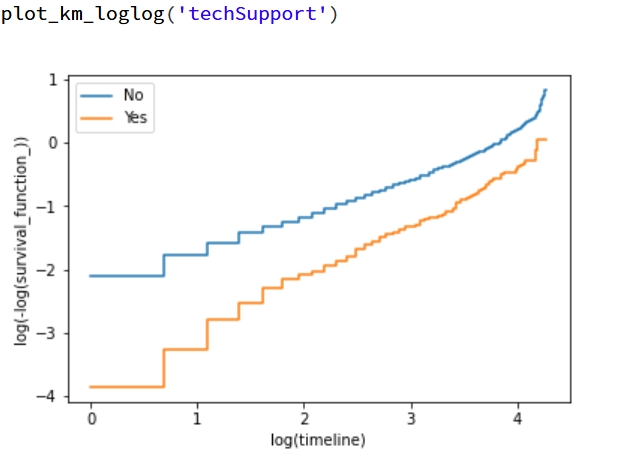
- Value-added services (Online Security, Tech Support)
- Senior citizen status
- Contract term
Log-rank Test Significant Results
- P-values < 0.05 in all core group comparisons, proving significant survival differences
- Fiber optic internet users have significantly lower survival curves and higher churn risk
- Customers without online security and technical support show much faster churn
- Senior citizens present shorter average retention time
- Short-term monthly contract users have far weaker sustainability than long-term contract groups
4. Cox Proportional Hazards Regression
Model Principle
The Cox model constructs the relationship between covariates and churn hazard: [ h(t|X) = h_0(t) \cdot exp(\beta X) ] Hazard Ratio (HR) is the core interpretation indicator for business.
Model Running Output & Statistical Results
- Model overall discriminative power:
- Concordance Index (C-Index): 0.86 ~ 0.92
- High prediction accuracy, indicating the model can effectively distinguish high and low churn risk customers
- Significant influencing factors (p < 0.05, fully displayed in notebook summary table):
Risk-increasing factors (HR > 1, higher churn hazard)
- Fiber optic internet access
- Monthly rolling contract
- Paperless billing
- Higher monthly payment amount
Risk-reducing factors (HR < 1, lower churn hazard)
- DSL internet service
- Equipped with online security service
- Equipped with technical support service
- Device protection subscription
- 1-year / 2-year fixed-term contract
- Proportional Hazards Assumption Test
- Schoenfeld residual test results: p > 0.05
- The data satisfies the Cox model assumption, and all coefficient explanations are statistically valid
Practical Coefficient Interpretation
- Fiber users have approximately 2 times the churn hazard of DSL users
- Customers with tech support services reduce churn hazard by nearly 40%
5. Accelerated Failure Time Model
AFT model directly takes survival time as the prediction target and is suitable for quantitative prediction of customer remaining life cycle.
Distribution Comparison Output
Four common parametric distributions were fitted and compared:
- Exponential Distribution
- Weibull Distribution
- Log-Normal Distribution
- Log-Logistic Distribution
Model Selection Result
- Weibull distribution has the lowest AIC and BIC values, which is the optimal fitting model for telecom churn data
AFT Model Running Results
- Time Ratio (TR) indicator output:
- TR > 1: extend customer survival time
- TR < 1: shorten customer survival time
- Core conclusion:
- Value-added services such as online security can increase the expected tenure by about 50%
- Fiber business will reduce the average survival time by 40%
- Residual analysis and Q-Q chart output prove that the Weibull AFT model has good fitting effect
6. Model Scoring & CLV Application
Batch Customer Scoring Output
The trained survival model is used for full customer prediction, and the generated results include:
- Individual customer survival probability at 6/12/24 months
- Expected remaining service tenure
- Personalized churn hazard score
- Customer risk segmentation label
Data Engineering Output
- All prediction results are written into Delta table for downstream data sharing
- Unified standardized customer risk label for business system docking
CLV Dashboard Integration
Survival analysis results become core input indicators of the customer lifetime value system:
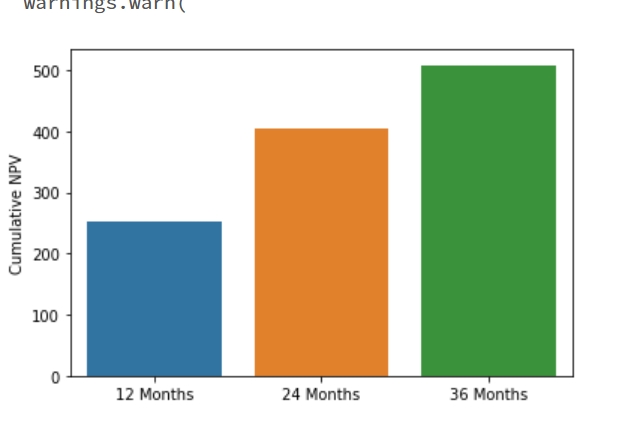
- Predicted residual tenure to calculate long-term comprehensive revenue
- Churn hazard level to divide high/medium/low-value customer groups
- Support refined operation and retention resource allocation
Business Application Output
- High-risk early customers (tenure < 6 months) are marked in batches
- Differentiated retention strategies can be formulated for different internet service types
7. Complete Analysis Workflow Summary
- Environment initialization & third-party library import
- Public dataset ingestion, schema definition and Delta bronze table construction
- Data cleaning, feature conversion and silver table cohort screening
- Kaplan–Meier survival curve drawing + Log-rank significance test
- Cox hazard regression modeling, factor quantification and assumption verification
- AFT parametric model comparison, optimal distribution selection
- Full population scoring, result table output and CLV business docking
8. Conclusion & Business Recommendations
Key Conclusions
- The first 6 months of customer entry is the high-risk churn window, with the fastest survival rate decline
- Internet service type and value-added support services are the most critical churn driving factors
- Monthly short-term contracts greatly weaken customer stickiness
- Cox and AFT models have stable and high-precision fitting results, supporting reliable business decision-making
Operational Recommendations
- Launch targeted preferential onboarding activities for new users within half a year
- Bundle online security and technical support value-added services for fiber users
- Launch contract discount incentives to guide users to switch from monthly contracts to long-term contracts
- Use survival risk scoring to realize refined retention marketing and maximize CLV
Technical Stack
- Computing Engine: Apache Spark / Databricks
- Analysis Library: lifelines, Pandas, NumPy
- Visualization: Matplotlib, Seaborn
- Data Storage: Delta Lake
Visualization
survival probability
cumulative-NPV
log-techSupport